AI Visual Content Creator
Generated by students using MyLens AI. We present here an example from Bioanthropology course content worlds, but this is just one example - we invite everyone to experiment with whatever materials they wish to explore. Here is an example of one class presentation from the semester, transformed into interactive visual format. You are invited to explore and engage with different Sociological Theories through these AI-generated visual summaries.
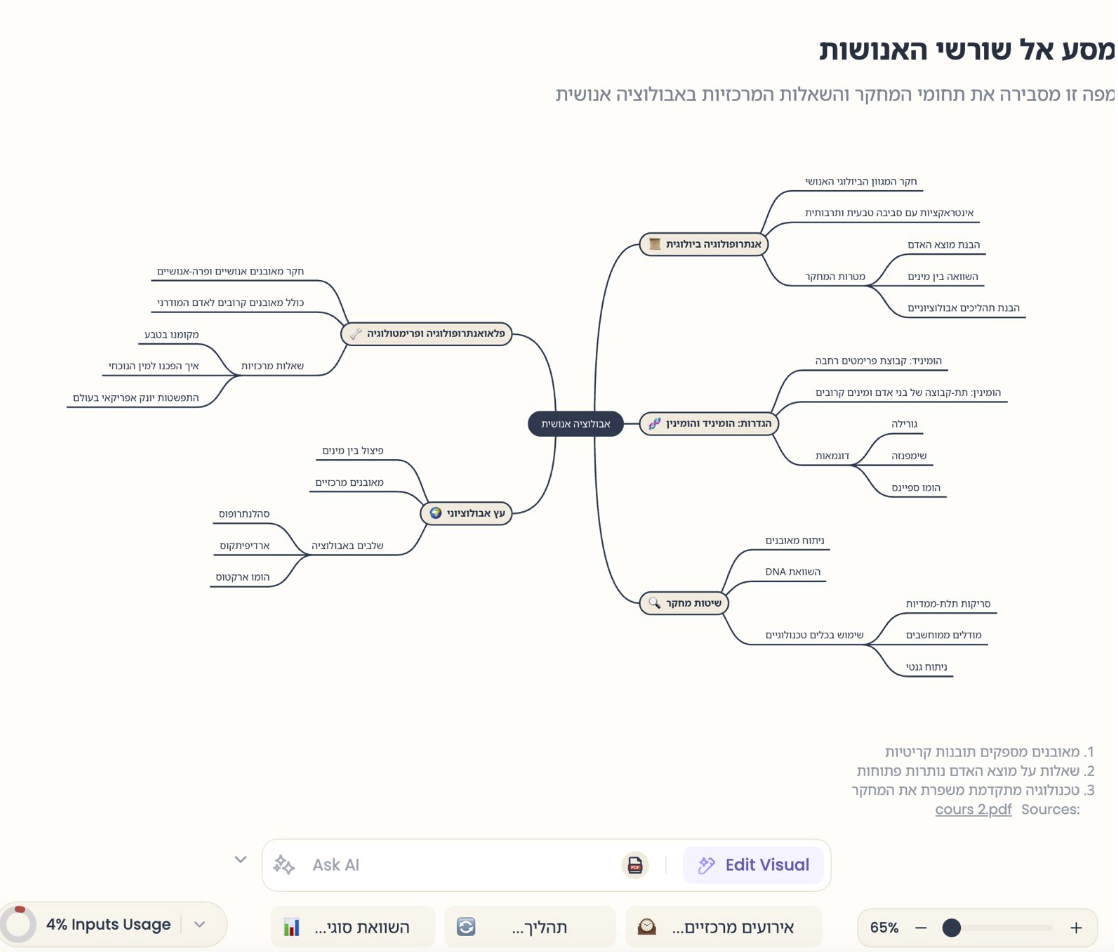
What you'll see: When you enter the MyLens AI website, you can input content in multiple ways: upload documents (PDFs, Word files), paste text directly, share URLs from websites or YouTube videos, or even use voice input to describe your ideas. The AI will then analyze your material and transform them into interactive visual formats—mindmaps showing theoretical connections, timelines of evolutionary concepts, flowcharts of research methodologies, tables comparing different anthropological approaches, and charts visualizing data relationships. Whether you input a dense academic paper on human evolution or a YouTube lecture on cultural anthropology, MyLens will extract key concepts and create customizable visual summaries.
Why this matters for first-generation students: Academic texts can feel intimidating and inaccessible, especially for students navigating university without family guidance. By transforming dense scholarly articles into clear visual formats, we make complex theories more approachable and digestible. This format allows students to engage with content through visual learning pathways, addressing different learning styles and the real-life constraints many first-generation students face when processing traditional academic materials.
Important ethical consideration: We ask - when AI transforms complex academic arguments into simplified visual formats, what knowledge is inevitably lost in translation? Are we creating a generation of students who mistake aesthetic clarity for intellectual understanding? As we prioritize accessibility through visualization, do we risk reducing nuanced scholarly debates to digestible infographics, potentially erasing the productive ambiguity and complexity that drives academic inquiry? How do we balance the genuine need for accessible learning tools with the risk of creating intellectual fast food - visually appealing but nutritionally hollow?
Our approach: We share this as part of our educational research into AI-enhanced visual learning, while acknowledging the complex copyright and access issues involved. This represents our attempt to practice "sharing with critical awareness" - one of our core commitments.
The visual content is generated by AI and should be understood as an interpretation of academic materials, not a replacement for original scholarship.